Yunji: Significant Upside Potential Should Margins Expand
Summary
Current share price does not do justice to the fundamental value of the business, considering the market growth of the industry and the company’s unique business positioning.
Based on our analysis, both the peer implied and the fundamental value suggest that the current share price does not fully reflect the potential, and it is currently under-priced.
We recommend that the company should trade between $10.62 and $11.74.
Executive Summary
Yunji (NASDAQ:YJ) is a relative newcomer to the stock exchange, having IPO'd during May 2019. The ADR price jumped on the listing, but it has been unable to find a stable base, resulting in the current share price being less than half of the original $11.00 IPO price.
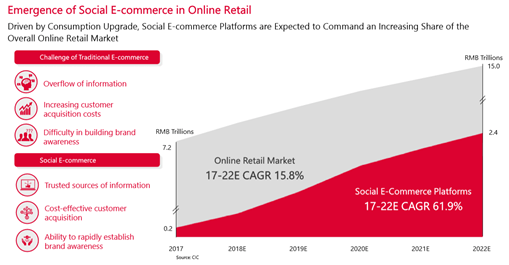
The company is a leading social e-commerce online retail platform that has been growing on the back of an increased share of social e-commerce platforms from the online retail market, which, according to the company, is due to rise to c.a. ¥15.0 trillion by 2022 at a CAGR of 15.8%.

Source: Craft, Silenda Investments
While the company has been incurring net losses, we believe that its membership and revenues are likely to continue to demonstrate strong future growth. Additionally, we believe that the company has the capability of turning a profit as soon as 2020 based on its implementation of the efficiency strategy, which should boost top-line growth at a faster rate than operating cost growth. As such, we estimate 2020 revenues of ¥23.6bn and a net profit of ¥0.1bn.
This though will be strongly dependent on the company being able to (1) keep increasing membership numbers, (2) continue increasing transaction activity and user retention rates, and (3) reduce the rising costs in proportion to increasing sales and thereby allow margins to recover.
We believe that there is a strong fundamental and peer implied case for the company. While the share price has fallen to just above $5.00 per ADR, it is Silenda Investments' belief that the company's fundamental value could be stronger at around $10.62-11.74 (an upside of 110.7-132.9%) relative to the current price of $5.04 per ADR, signaling a strong BUY recommendation.
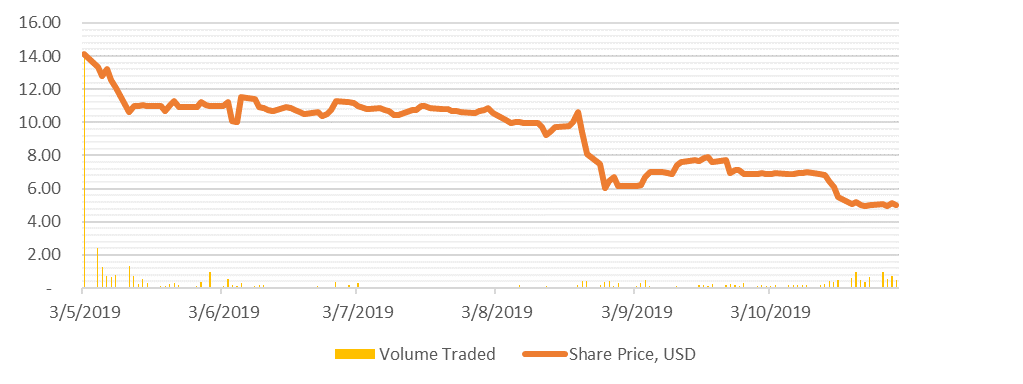
Share Price Movement
Source: Yahoo Finance
Yunji successfully completed an IPO of 11,000,000 ADRs on 3 May, 2019. Each ADR, which was priced at $11.00, represents 10 Class A ordinary shares of the company. The underwriters then exercised their over-allotment option to purchase an additional 217,447 ADRs on 4 June, 2019. The money was raised for the purpose of investing in basic technology infrastructure construction, business operations, and service improvement. After an initial spike on listing, the ADR price has struggled to maintain the IPO price and has approximately halved to the current price level of $5.04.
Company Overview
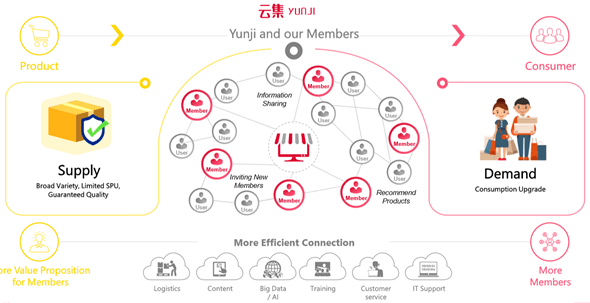
Yunji was founded in 2015 by Xiao Shanglue, e-commerce veteran, as an innovative, membership-based social e-commerce platform. It is a social e-commerce service platform that uses social relationships on apps such as WeChat to acquire, engage and sell to users.
It now offers China's consumer base more than 6,600 products and is recognized as being the largest of the kind, measured in gross merchandise value, in China. The company recognizes different drivers as having contributed to its success, including superior social shopping experience, a highly-engaged user base, and well-managed and selected products which are offered at attractive prices.
As such, the Yunji application creates a great shopping experience that is mixed with social features. Both experiences allow users to explore, discover, and buy a large range of products. These allow the purchasers to satisfy their daily needs for themselves and their households. The products on offer include mainstream brands, private labels, and emerging brands. The Standard Product Units (SPUs) are tightly controlled so as to ensure quality in order to be able to deliver large sales volumes per SPU and maintain an optimized cost structure.
Company milestones
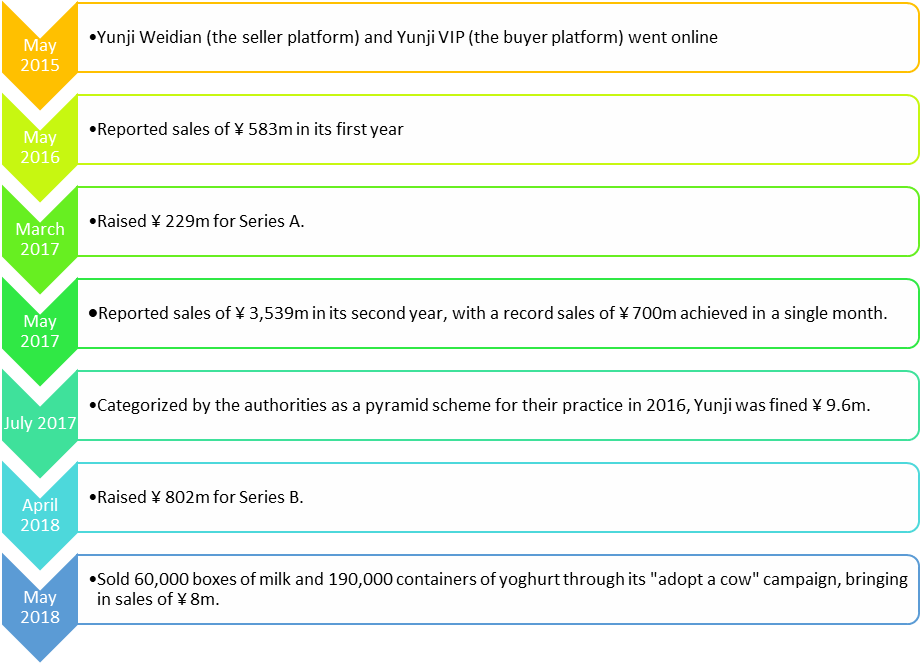
Source: WALKTHECHAT
Key statistics
The company reported indicators that suggest that its popularity continues to grow with expanding user numbers, transaction values and orders fulfilled.
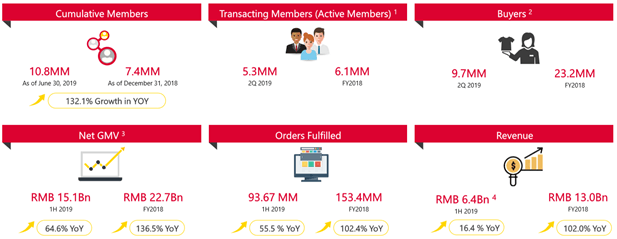
Source: Yunji
According to Craft, Yunji's online and social media presence has also been on the rise, peaking in April/May 2019 before settling back down. This may correspond with the growth in the second quarter.
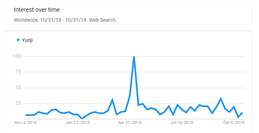
Source: Craft
Key Shareholders
Major Shareholders (>5% shareholding) | ||
Shareholder | # of Shares | % of Shares |
TBP Investment Advisory (HK) | 13,173,639 | 10.90% |
Source: CNN Business
Recent Developments
- Yunji received $109.0m in net proceeds from the IPO and the related over-allotment option arrangement. All classes of preferred shares (originally classified as Mezzanine Equity) were converted and re-designated as 895,216,752 Class A ordinary shares on a one-for-one basis immediately prior to the completion of the IPO.
- On 28 June, 2019, Yunji announced that Jun Zhang had been appointed as Chief Operating Officer to oversee the supply chain management, while Jianjian Hu, the former chief operating officer, was appointed as Chief Marketing Officer to lead operations and marketing for Yunji's mobile application.
- It was announced on 28 August, 2019, that the Yunji board of directors authorized a share repurchase program under which it may repurchase up to $20m of its shares over a six-month period.
Unique points
Yunji places strong emphasis on its brand selection approaches together with big data analysis which analyzes seasonality, historical data and user feedback. This is done in order to try to predict and recommend the right products for customers. Additionally, the platform highlights products and focuses on products that would assist users with their daily needs.
The platform is a unique social e-commerce platform with a shopping experience driven by the users' social connections and the community. The application can interface with popular social network platforms including WeChat, Weibo (NASDAQ:WB), and QQ, resulting in users sharing favorite products with friends through these channels.
Source: Yunji
According to the company, the products that are offered on the platform are subject to careful selection and require:
- High-quality brands that can generate a high margin (private labels, emerging brands and high-quality manufacturers);
- existing manufacturers for mainstream brands or those that have proven records;
- high-quality self-owned/invested brands;
- emerging brands with good products that are not yet widely recognized by consumers; and
- high-frequency supermarket-quality fruits and products, including grocery products that meet the day-to-day needs of the members such as milk, grain and oil, vegetables, fruits, snacks and other daily necessities.
There are also mainstream products, including global and domestic mainstream brands, that are periodically replaced. These products are required to have a proven quality record, long-established brand recognition, and can be used to reduce decision-making costs and time for the users.
Overview of Industry Trends
According to Yunji, there is a significant growth opportunity for companies operating social e-commerce platforms. It is estimated by the company that from 2017 to 2022, this sector has the potential to grow at a CAGR of 61.9%, which is significantly faster than the generic online retail market.
Source: Yunji
This is supported by comments by Absolunet, which stated that e-commerce could represent 15% of all specialty retail sales in North America and a higher 23% in China. This has been supported by mobile e-commerce, which experienced an increase in sales of 55% year-on-year. Consumers now require a merging of the online and offline worlds, and e-commerce is no longer being viewed as a separate commercial entity.
Further, according to eMarketer, there has been a 110% growth over two years in social referrals to retail e-commerce sites. Facebook (NASDAQ:FB) is the main portal for social referrals. However, both Instagram and Pinterest have also acted as important launch sites. In China, it would seem WeChat acts as a key source for referrals.
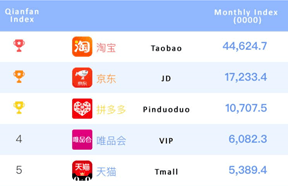
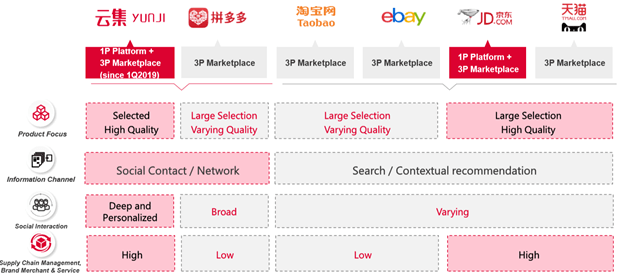
Competitor Analysis
Yunji's main competitor is Pinduoduo (NASDAQ:PDD), which also classifies itself as a social e-commerce service and takes advantage of social relationships on applications such as WeChat. Both companies acquire, engage and sell to users. However, the two companies differ in terms of how they make money. The majority of Pinduoduo's revenue is derived from advertising fees paid by merchants - similar to Alibaba's (NYSE:BABA) marketplace, while Yunji focuses on direct sales similar to Alibaba's main competitor JD.com (NASDAQ:JD).
Key Competitors
Source: WALKTHECHAT
In terms of size, Yunji's revenue last year was about $15m behind Pinduoduo. In 2018, Yunji had 23.2m buyers as compared to Pinduoduo's 272.6m. Additionally, while Yunji spent most of its expenses on fulfillment and logistics, Pinduoduo spent most on sales and marketing.
Source: Craft
According to Yunji, it has differentiated itself from its competitors. While there are some similarities based on the various criteria, but the main point of differentiation that sets it uniquely apart from the competitors that it identified is the deep and personalized social interaction with its users.
Source: Yunji
Financial Perspectives
The company reported ¥13.0bn in revenue in 2018, which represents an impressive 102% year-on-year growth relative to the ¥6.4bn earned in 2017. However, due to rising costs, the company continued to generate a 2018 net loss of ¥56.3m, though the loss had approximately halved from the 2017 net loss of ¥105.7m.
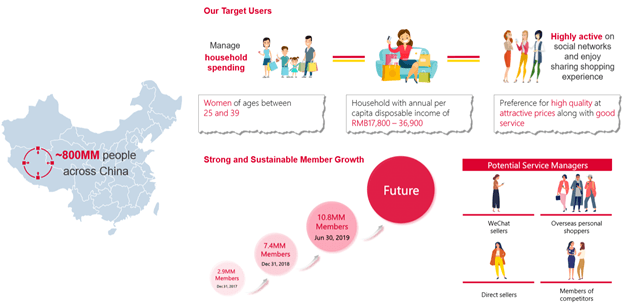
During Q2 2019, the company stated that it had increased its gross merchandise value (GMV) by 46.4% year-on-year to ¥8.2bn and increased its cumulative number of members from 9.0m to 10.8m quarter-on-quarter. The strength of the platform is supported by the fact that the number of actual transacting members had grown by 125.1% year-on-year for the 12 months ending 20 June 2019.
The company's GMV growth has been supported by its three key strategies, namely:
- Controlling costs, especially in terms of allocating resources and preventing excess spending on promotions;
- by effectively managing the supply chain; and
- by further enhancing the social features of the platform and thus improve the benefits for the platform members.
However, part of the cost of doing so, the company has had to invest more in its data and technology infrastructure. This caused the operating expenses to increase during the quarter from ¥590.3m to ¥792.9m year-on-year. A further contributing factor to this was the increased branding and promotional activities undertaken by the company, partly as a result of costs incurred relating to the IPO. The company indicated that it should now be able to return its operating efficiency to previous levels.
In addition to focusing on improved efficiency, the company is focusing on member growth and user retention rates. This should support further GMV growth, with Q3 being higher than Q2 and Q4 seasonally being the highest quarter.
Source: Yunji
Furthermore, Shanglue Xiao (Chairman and CEO) stated that a healthy growth rate was maintained, as the company continued to optimize and upgrade its new marketplace business model. Supplier agreements were also updated so as to improve the value proposition to members. The company also focused on carefully selecting new brands and curate quality products at attractive prices that best match members' demand. This resulted in the further expansion of the company's membership. Based on this, Yunji expects that the operational progress and membership expansion will be a driver for future growth.
Additionally, as the company continues to fine-tune the business model, plans have also been made to improve the operating efficiency in the future by gradually increasing the commission rate charged to merchant partners. Further, a healthy level of working capital will be maintained to meet the company's liquidity needs in terms of operations and commitment. In this way, the company is confident that it will be able to deliver sustainable shareholder returns in the long term.
Source: Yunji
Highlights from Q2 2019
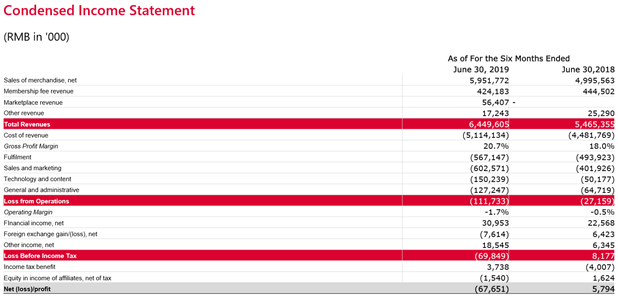
- Total revenues decreased to ¥3,064.1m ($446.3m) (Q2 2018: ¥3,255.6m). This was primarily due to a decrease in revenues from sales of merchandise (part of the merchandise sales shifted to the marketplace platform). These revenues included:
- Revenues from sales of merchandise - decreased 8.7% year-on-year to ¥2,731.6m ($397.9m). The decline occurred due to merchandise sales being shifted to the new marketplace platform.
- Revenues from the membership program - increased by 9.4% year-on-year to ¥267.6m ($39.0m). The increase was driven by the continual growth of the membership base.
- Revenues from marketplace business - reached ¥53.0m ($7.7m) after being launched in Q1 2019.
- Other revenues - declined reduced by 32.9% year-on-year to ¥11.9m ($1.7m).
- The total cost of revenues decreased by 8.9% year-on-year to ¥2,383.1m ($347.1m), equivalent to 77.8% of total revenues (Q2 2018: 80.3% of total revenues). The decrease was mainly due to a decline in merchandise sales.
- Total operating expenses increased from ¥590.3m in Q2 2018 to ¥792.9m ($115.5m). This was partly due to the 2.3% year-on-year increase in fulfillment expenses to ¥296.5m ($43.2m) because of an increase in personnel costs, and an increase in user information security expenses which was partially offset by the reduction in warehousing and logistics expenses. There was also a 44.2% year-on-year increase in sales and marketing expenses to ¥339.4m ($49.4m) from ¥235.4m in Q2 of 2018.
- The increase in sales and marketing expenses was due to the increased member management fees, increased brand and business promotional activities, increased share-based compensation expenses, and increased personnel costs. The company also increased technology and content expenses from ¥32.0m to ¥91.6m ($13.3m), as the company increased personnel costs, and the increased server costs, caused by higher user traffic. The company's general and administrative expenses went up by 97.9% to ¥65.4m ($9.5m) from ¥33.0m in Q2 of 2018, predominantly because of increased personnel costs and increased share-based compensation expenses.
- With higher costs, the company incurred a loss from operations of ¥111.9m ($16.3m) compared to the Q2 2018 profit from operations of ¥50.6m.
- This led to a net loss for the period was ¥84.5m ($12.3m) compared with a net income of ¥87.4m in Q2 of 2018 (the adjusted net loss amounted to ¥39.2m ($5.7m)).
- This translates to a net loss per share of ¥0.28 ($0.04) as compared to ¥0.33 in Q2 of 2018.
Looking to the Future
Looking ahead, based on the company's growth strategy and the outlook for the industry, Silenda Investments expects further revenue growth going forward, with estimated revenues for 2019 of ¥16.3bn and 2020 of ¥23.6bn. This is in line with the general market consensus, though Silenda Investments is more conservative in terms of the potential net margin recovery. Indications from the company suggest that the net loss during the second half of the year should lessen compared to the first half, leaving the full-year forecasted net margin being -1.3% (i.e. a net loss for the full year of ¥0.2bn).
However, as the company's level of efficiency begins to recover and re-approach the previous levels and comparable to JD.com and Amazon (NASDAQ:AMZN) margins (though the potential achieved by the eBay (NASDAQ:EBAY) could suggest a significantly higher opportunity). This would suggest that 2020 could see the company turn profitable with a NOPAT of ¥0.1bn, rising to ¥1.4bn by 2023. This, though, will be strongly dependent on the company being able to (1) keep increasing membership numbers, (2) continue increasing transaction activity and user retention rates, and (3) reduce the rising costs in proportion to increasing sales and thereby allow margins to recover.
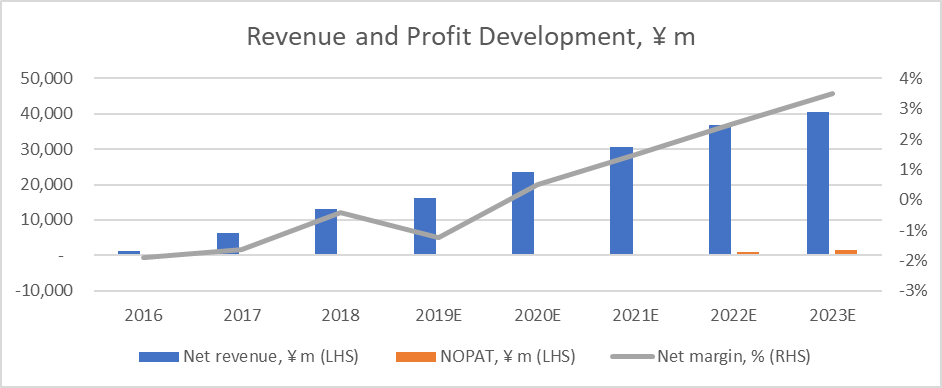
Source: Craft, Silenda Investments
Key Risks
- In 2018, Yunji had 7.4m members who contributed 11.9% of its annual revenues and 66.4% of annual transactions. However, through the excessive exploitation of the social links that it controls, things started to resemble a pyramid scheme (which banned in China). Already in 2017, the local government fined Yunji $1.4m for pyramid selling. As a result, the company apologized and agreed to revamp its marketing strategy. Eventually Yunji decided to issue virtual Yun-coins, which can be used as coupons for future purchases (and are not redeemable for cash), but the company stressed in its prospectus that, at any time, what constitutes pyramid selling could be redefined in China.
- Likewise, the Chinese government regulates internet access and the news and information that is distributed over it. This means that internet content providers and internet publishers are prohibited from using the internet to post or display content that violates any laws and regulations of the country, impairs the national dignity of the country, or is reactionary, obscene, superstitious, fraudulent or defamatory. If the Chinese government feels that any of these laws are violated, it can revoke licenses and prohibit the publishing of internet content, the revocation of other licenses, and the closure of the concerned websites. Thus, any violation could be devastating for both Yunji's reputation and operations.
- The company is exposed to the generic e-commerce risks that include issues such as online security, reputation, dealing with customer disputes, system reliability, privacy, fraud, intellectual property rights, and SEO.
- Other generic risks include the fragmentation of the market, which can lead to the death of brand loyalty, the cost of combating online return rates which can reach up to 50%, and the increasing pressure from consumers to use green and ethically sourced and manufacturing materials.
Company Valuation
Fundamental Valuation
The company is valued initially using a five-year DCF valuation, using a calculated cost of equity and WACC of 10.5%. Assuming the continued strong top-line growth and conversion from losses to profits discussed above, it is calculated that the company has an equity value of $2.4bn. This is well above the current market value of $1.1bn.
¥m | 2019E | 2020E | 2021E | 2022E | 2023E | Terminal |
NOPAT | -203.4 | 118.0 | 460.0 | 920.0 | 1,416.8 | 1,487.7 |
Add: depreciation | 4.1 | 4.4 | 4.6 | 4.6 | 4.7 | 4.9 |
Less: capex | -17.3 | -22.8 | -26.5 | -28.1 | -26.9 | -24.0 |
Change in NWC | -162.7 | -212.3 | -245.3 | -257.6 | -242.9 | -212.5 |
FCFF | -379.3 | -112.7 | 192.8 | 638.9 | 1,151.7 | 1,256.0 |
WACC | 10.5% | 10.5% | 10.5% | 10.5% | 10.5% | 10.5% |
Terminal growth rate | 5.0% | |||||
Discounted FCFF | -373.0 | -100.3 | 155.2 | 465.4 | 759.0 | 14,985.7 |
Enterprise value | 15,892.0 | |||||
Net debt | -1,519.1 | |||||
Estimated equity value | 17,411.1 | |||||
Number of ADRs, m | 218.0 | |||||
Value per ADR, ¥ | 79.86 | |||||
Value per ADR, $ | 11.18 |
Source: Silenda Investments
With 218m ADRs currently in the market, this implies a fair value price per ADR of $11.18, which is c.a. 121.8% above the last closing price of $5.04. This is approximately the same price as the company's initial listing price earlier this year, suggesting that the company was fairly valued during the IPO process.
Industry Valuation
In terms of the e-commerce industry peers, it is not possible to compare Yunji's current multiples, as the losses imply meaningless multiples for the company.
EV/EBITDA | P/E | Forward P/E | |
Yunji | n.m. | n.m. | n.m. |
Alibaba Group Holding | 25.7 | 31.9 | 26.4 |
Pinduoduo | n.m. | n.m. | 112.4 |
JD.com | 36.9 | 51.8 | 30.4 |
Amazon.com | 26.1 | 79.3 | 53.8 |
Best Buy Co | 7.7 | 13.1 | 12.1 |
Revolve | 34.5 | 235.3 | 24.6 |
eBay | 8.8 | 16.0 | 11.8 |
Median | 26.1 | 51.8 | 28.4 |
Mean | 26.2 | 82.3 | 43.3 |
Source: GuruFocus, Silenda Investments
Applying the low end of the peer forward P/E range (i.e. eBay) would suggest a price of $6.17 per ADR. However, when looking at the forward median P/E is 28.4x and applying it to the 2020E EPS of $0.52 suggest that the company's implied fair value would be c.a. $14.87 per ADR. This would also imply that there is upside potential for the ADR price. Based on the valuation, it would be recommended to BUY the company. It would currently appear to be underpriced in terms of both its fundamental value and its multiples relative to the industry on a forward-looking basis.
Disclosure: I/we have no positions in any stocks mentioned, and no plans to initiate any positions within the next 72 hours. I wrote this article myself, and it expresses my own opinions. I am not receiving compensation for it (other than from Seeking Alpha). I have no business relationship with any company whose stock is mentioned in this article.